Google Forms and Displaying Data
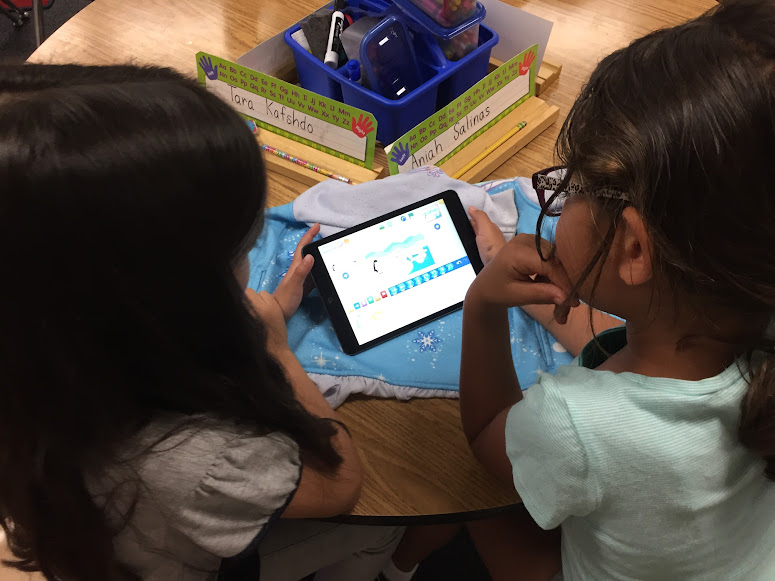
Today I was able to spend the day in Lindsey Blass' 6th grade class at Campbell Middle School. Yesterday, students used Google Forms to find out more their classmates. Lindsey had sent out a link to the Google Form she had created. Students responded with their birthday month and their height.

She then made copies of the survey results summary. Students were very excited to use the Pie Chart and Percentage Tables that were class-created the day before.

The essential question for the day was "How can we display our data in a meaningful way?" Using Cornell Notes, students later interpreted the data and displayed it on a dot plot. Students were highly engaged with this real-world summary of data.

What a wonderful way to introduce Google Forms, Essential Questions, Dot Plots, Cornell Notes, and Interactive Journals. Thank you, Lindsey and Room B9!
She then made copies of the survey results summary. Students were very excited to use the Pie Chart and Percentage Tables that were class-created the day before.
The essential question for the day was "How can we display our data in a meaningful way?" Using Cornell Notes, students later interpreted the data and displayed it on a dot plot. Students were highly engaged with this real-world summary of data.
What a wonderful way to introduce Google Forms, Essential Questions, Dot Plots, Cornell Notes, and Interactive Journals. Thank you, Lindsey and Room B9!


Comments
Post a Comment